DYNAX - Renal Scintigraphy
Brand: MiE GmbH | Category: Nuclear Medicine & Imaging
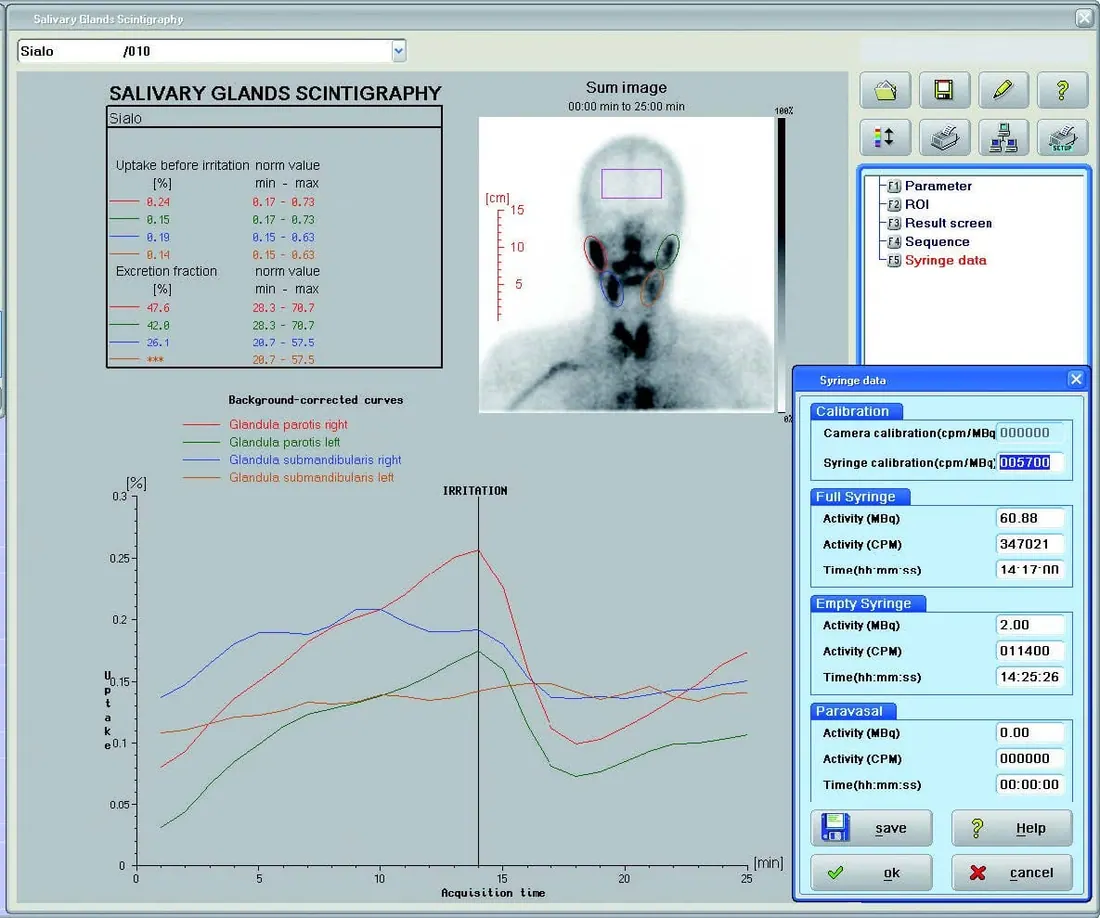
A SCINTRON program for quantitative analysis of dynamic studies. For renal work it determines side ratios, calculates counts and region sizes, and shows renal function as curves. The same program handles salivary gland studies, giving uptake before irritation and the excretion fraction.
Technical Specifications
| Parameter | Value |
|---|---|
| Specification | Evaluation of renal studies to determine side ratios |
| Specification | Counts and region of interest sizes calculated |
| Specification | Renal function illustrated by curves |
| Specification | Quantitative analysis of dynamic salivary gland studies |
| Specification | Uptake before irritation and excretion fraction determined |
| Specification | Option to display normal data values |
Get a Quote
Request an itemised quotation covering the proposed configuration, availability, lead time and agreed supply and support scope.
Useful details to share
- Department workflow and intended equipment use
- Required configuration and existing system interfaces
Share what you know. You can start with your name and a phone number or email; final specifications can follow.
Not sure which configuration you need? Help me choose
Contact Vvon Technologies Limited about MiE GmbH equipment requirements in Bangladesh.
Phone: +8801805987890 | Email: info@vvon.com.bd
Back to Nuclear Medicine & Imaging
More from Imaging & QA Software
- Analysis of Suppression
A SCINTRON program that compares a thyroid uptake study acquired before suppression with one acquired after it. The same regions are applied to both studies, and the ratio between the two is calculated automatically as a percentage alongside the uptake and area figures for each acquisition.
- Deconvolution
A SCINTRON processing option that improves the signal to noise ratio of planar studies using standardised parameters, so contours are displayed more sharply. MiE make it available for the Bone, WholeBody and Multidisplay programs, and the result can be read against the raw data side by side.
- AutoPIA
Automatic Phantom Image Analysis software that recognises and analyses test images of Leeds Test Objects phantoms. It calculates reproducible quality indices, stores the results and plots control charts with baseline and threshold values so quality trends and abnormal conditions are visible.